Accedi a decisioni concrete di investimento che ci hanno resi famosi.
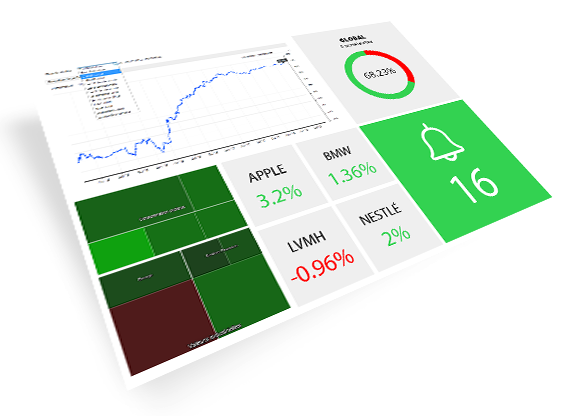
Segui con totale trasparenza le nostre posizioni e le performance dei nostri tre portafogli gestiti al meglio sui mercati: Europa, Stati Uniti, Asia. Le nostre performance sono reali, al netto delle commissioni di intermediazione e delle imposte sulle transazioni.
I nostri portafogli sono composti da società liquide.
I valori sono suddivisi per paese/settore al fine di ridurre il rischio.
Verrai informato di ogni operazione da noi eseguita.
*Le performance passate non sono garanzia di performance future.
Una banca dati globale senza eguali
Il nostro database è il punto di riferimento per gli investitori più esigenti. Alimentato dalle migliori fonti, copre tutti i mercati e tutti gli strumenti quotati. Che si tratti di monitorare il vostro portafoglio, un settore o di cercare nuove opportunità, la nostra piattaforma vi offre una visione completa su un unico portale.
Media di riferimento e approfondimento informativo senza pari
MarketScreeener è il media di riferimento per seguire i mercati finanziari. Approfitta della nostra indipendenza e competenza con una visione globale e a 360 gradi: azioni, ETF, settori, economia, indici, valute, criptovalute, materie prime.
Ogni mese, la nostra offerta informativa attira milioni di investitori provenienti da oltre 90 Paesi e viene riconosciuta a livello globale per la sua affidabilità, tempestività, ampiezza e per il valore aggiunto.
Acquisisci una visione d'insieme con articoli, analisi e approfondimenti redatti dal nostro team di giornalisti, analisti e scienziati, esperti dei mercati finanziari.
Segui i mercati in tempo reale grazie a flussi di informazioni provenienti dalle migliori fonti mondiali, disponibili in sette lingue e tradotti automaticamente per una lettura immediata.
Usufruisci della base di documenti più completa disponibile online: avrai accesso a informazioni ricche e approfondite che ti permetteranno di seguire titoli e settori o di individuare società specifiche.
Accedi al lavoro di sintesi dei nostri giornalisti, che si alzano presto e vanno a dormire tardi per tenerti fedelmente informato e farti risparmiare tempo.
Gli esperti di MarketScreener forniscono analisi e consigli quotidiani. In questo modo potrai scoprire o riscoprire società in cui investire o da evitare.
Redatti dal nostro team di esperti, i nostri articoli di approfondimento ti aiuteranno a prendere le tue decisioni e a comprendere le nostre.
Selezioniamo società di qualità, ovvero aziende in crescita, redditizie e senza un eccessivo ricorso all'indebitamento, con livelli di valutazione ragionevoli rispetto ai loro vantaggi. Il tempo gioca a loro favore.
Seguiamo costantemente 70 temi di investimento che sono di attualità o che corrispondono a tendenze di fondo.
Consulta i nostri elenchi di titoli sotto forma di portafogli con le relative performance, l'esposizione settoriale e geografica. Ogni tema è spiegato in dettaglio e gli elenchi delle società sono aggiornati con regolarità.
Segui i tuoi titoli o importa le tue informazioni per gestire efficacemente i tuoi investimenti grazie ai nostri strumenti, database e notizie:
Crea fino a 10 liste di 50 titoli per monitorare le tue società preferite: quotazioni in tempo reale, informazioni, pubblicazione dei risultati, andamento delle stime, raccomandazioni dei broker.
Imposta i tuoi avvisi per non perdere nessuna informazione.
Come i grandi investitori e gli analisti professionisti, avvicinati alle aziende accedendo alle trascrizioni dei risultati finanziari, alle conferenze con gli investitori o alle presentazioni realizzate dall'azienda.
Ogni trascrizione è strutturata e organizzata in modo da consentire una facile navigazione tra le dichiarazioni dei dirigenti e le domande degli analisti o degli investitori.
Troverai inoltre un'analisi positiva dei contenuti e una classificazione delle parole chiave utilizzate.
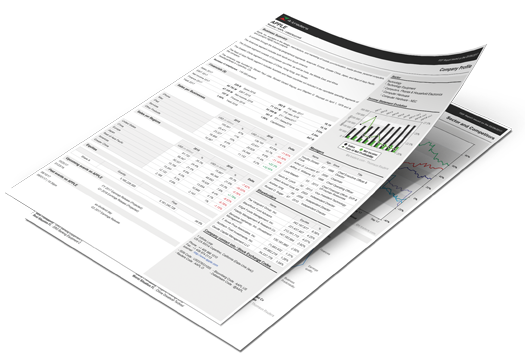
Sempre aggiornati e ideali per l'analisi fondamentale e la generazione di idee. Per un utilizzo immediato, per una riunione o per un comitato di investimento, possono essere stampati, annotati, condivisi e archiviati.
Scaricabili e disponibili per oltre 60.000 società quotate, i rapporti sintetici di 6 pagine contengono tutte le informazioni dettagliate e offrono una visione completa di ogni società:
L'abbonamento Access si rivolge agli investitori autonomi esigenti che sono alla ricerca di informazioni e dati.
L'abbonamento ad Access include molti vantaggi, tra cui:
Navigazione illimitata senza ad-blocking, con accesso completo e illimitato a tutte le notizie, agli articoli e alle analisi di MarketScreener
Accesso gratuito alle newsletter giornaliere (Morning Meeting) e settimanali (Rassegna Settimanale di Borsa)
Accesso gratuito a tutte le nostre guide a pagamento che potrai facilmente scaricare dal tuo account MarketScreener
Assistenza clienti per aiutarti e accompagnarti
Accesso gratuito all'applicazione iPhone a pagamento di MarketScreener
Accesso a numerosi elenchi tematici di investimento, elenchi di titoli appositamente studiati per ogni stile di gestione o di investimento (titoli: growth, scontati, a dividendo, quality, ESG, multibaggers, con strategia offensiva, dinamici, ecc.)
Accesso a più di 50 azioni classificate in base al settore di esposizione o a un tema particolare (solare, eolico, videogiochi e e-sport, difesa, idrogeno, internet, intelligenza artificiale, robotica, e-commerce, fintech, blockchain, metalli strategici o rari, ecc.)
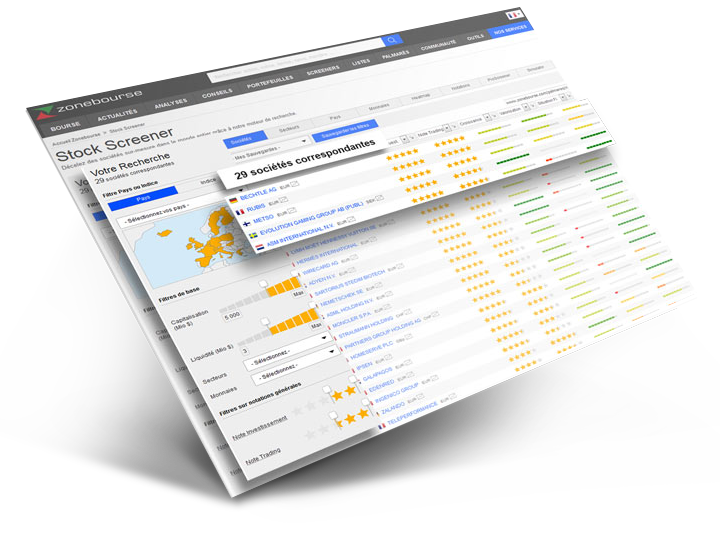
Accesso allo Stock Screener più avanzato del mercato, per classificare e confrontare tutte le società
Scoring aziendale esclusivo (punteggio di investimento e di trading disponibile tramite il nostro Stock Screener) basato su numerosi criteri (crescita, valutazione, revisione EPS a lungo termine, situazione finanziaria, redditività, pubblicazione e visibilità, revisione EPS a breve termine, ecc.) che permettono ai nostri clienti di identificare rapidamente quali investimenti classifichiamo a lungo o breve termine
Accesso alla generazione automatica di report finanziari in formato PDF su tutte le società quotate in Borsa in tutto il mondo
Accesso esteso a elenchi personalizzati (10 * 50 titoli)
Accesso esteso ai portafogli virtuali (10 * 50 titoli)
Accesso a centinaia di metriche fondamentali
Dati fondamentali di qualità istituzionale: collaboriamo con tutti i fornitori di data finanziari e borsistici più affidabili e riconosciuti al mondo (Refinitiv, S&P Global, MorningStar, Factset, etc.)
Cosa comprende l'abbonamento Premium?
L'abbonamento Premium è dedicato agli investitori che desiderano seguire le nostre opinioni e decisioni per accompagnarli sul mercato azionario.
L'abbonamento Premium include numerosi vantaggi:
Tutti gli strumenti, i servizi e i contenuti dell'abbonamento Access
Accesso illimitato a tutti i consigli dei nostri esperti per aiutarti a ottimizzare la performance dei tuoi investimenti
Accesso ai 3 portafogli con investimenti reali: UE, USA, Asia per seguire e replicare i nostri investimenti e aiutarti a sovraperformare i mercati
Accesso illimitato allo Stock Screener più avanzato del mercato con cui classificare e confrontare tutte le società.
Accesso illimitato alla generazione automatica di report finanziari in PDF su tutte le società quotate in Borsa a livello mondiale
Accesso alla Newsletter Premium
Questo pacchetto ti aiuterà a ottimizzare la performance dei tuoi investimenti e a sovraperformare i mercati.
Cosa comprende l'abbonamento Expert?
L'abbonamento Expert è dedicato agli investitori che cercano strumenti decisionali per gli esperti in investimenti.
L'abbonamento Expert include numerosi vantaggi:
Tutti gli strumenti, i servizi e i contenuti dell'abbonamento Premium
Assistenza telefonica personalizzata, in diretta con i nostri esperti
Accesso alla versione Pro dello Stock Screener
Accesso all'Event Screener
Accesso illimitato alla generazione automatica di report finanziari in PDF su tutte le società quotate in Borsa a livello mondiale, nonché possibilità di personalizzare questi modelli di report finanziari
Accesso esteso alle liste personalizzate (50 * 500 titoli)
Accesso esteso ai portafogli virtuali (20 * 100 titoli)
Questo pacchetto ti aiuterà a raggiungere nuovi traguardi nella performance dei tuoi investimenti e nella padronanza e comprensione dei mercati azionari.
Cosa giustifica il prezzo dei vostri abbonamenti?
MarketScreener offreil miglior rapporto quantità/qualità-prezzo.
Vi saranno altre aziende che offrono abbonamenti più economici, ma nessuna fornisce un servizio così completo come MarketScreener in termini di informazioni, strumenti, analisi, consigli, portafogli realmente investiti, ecc.
MarketScreener offre il servizio più esaustivo per investire in Borsa.
Tutte le notizie di Borsa del mondo in diretta
Contenuti esclusivi di MarketScreener ad alto valore aggiunto, tra cui le nostre analisi e i nostri consigli di investimento
Un database ineguagliabile che copre più del 99,9% delle società quotate in Borsa a livello mondiale
I migliori strumenti di Borsa di analisi e stock screening che offrono una gamma completa di strumenti per investire in Borsa
3 portafogli con investimenti reali: UE, USA, Asia per consentirti di replicare i nostri investimenti e livelli di performance che sovraperformano i mercati globali
Formazione per aiutarti a progredire e a comprendere meglio i mercati
L'applicazione di Borsa più completa sul mercato
MarketScreener fornisce agli utenti dati chiari, facili da usare, di qualità e approfonditi, così da farti sovraperformare il mercato e diventare il tipo di investitore che desideri essere.
Come riuscite a offrire così tanti strumenti e un contenuto di qualità?
Tutti gli investitori meritano di avvalersi di informazioni di qualità basate su dati affidabili. L'avvio della nostra attività risale al 2001, pertanto abbiamo trascorso gli ultimi 20 anni a creare gli strumenti necessari per gestire, monitorare e analizzare i mercati e far crescere i nostri portafogli.Ecco perché i nostri strumenti sono così utili ed efficienti, poiché si basano sulle esigenze concrete di tutti gli investitori informati.
Per quanto riguarda la qualità dei nostri contenuti, abbiamo progressivamente costruito e ampliato i nostri team di analisti e giornalisti per offrire quotidianamente contenuti esclusivi e di alta qualità ai nostri clienti. In MarketScreener non c'è un solo membro del team che non sia esperto nel suo campo.
Potrò accedere a MarketScreener da più piattaforme?
Sì, potrai accedere a marketscreener.com tramite il sito mobile e desktop, nonché tramite l'applicazione mobile iOS (gratuita a partire dal pacchetto Access).
Con un unico abbonamento, posso accedere a tutte le edizioni (IT, US, FR, ES, etc.)?
Ogni edizione dei nostri prodotti è considerata un sito a sé stante, con i propri contenuti esclusivi, notizie adattate e punti salienti (quotazioni, mercati, ecc.) conformi a ogni edizione. Tuttavia, offriamo a tutti i nostri iscritti la possibilità di accedere a tutte le nostre edizioni connettendosi con le credenziali della loro edizione originale.
Quanti titoli, indici, quotazioni coprite?
Accedi all'offerta di informazioni finanziarie e di Borsa più completa del mercato che copre oltre il 99,9% delle società quotate al mondo.
I nostri sistemi di valutazione e analisi, sia tecniche che fondamentali, sono aggiornati quotidianamente su quasi 20.000 società.
Copriamo inoltre quasi 10.000 ETF e più di 280.000 indici, nonché tutti i tipi di quotazioni (valute, criptovalute, materie prime, ecc.).
Chi vi fornisce tutti i dati?
Collaboriamo con tutti i fornitori di dati finanziari e di Borsa più affidabili e riconosciuti al mondo, quali Refinitiv, S&P Global, MorningStar, FactSet e molti altri.
Cosa devo fare se ho problemi con il mio abbonamento?
Puoi contattarci in qualunque momento. La nostra assistenza clienti è disponibile durante gli orari di apertura per rispondere a tutte le tue domande. È composto da persone ed esperti reali che ti accompagnano nell'utilizzo del nostro sito, così da ottimizzare la performance dei tuoi investimenti.
Come posso fare nel caso voglia annullare il mio abbonamento?
Se desideri disdire l'abbonamento a MarketScreener, potrai farlo in qualsiasi momento, in modo molto semplice e rapido tramite il pulsante "Disdire" disponibile su "Il mio account" > "I miei abbonamenti".
Quali metodi di pagamento accettate?
Attualmente accettiamo qualsiasi carta di credito o di debito come MasterCard, Visa, American Express, GPay, ApplePay. Accettiamo anche PayPal. Tutti i pagamenti vengono elaborati in modo sicuro tramite Stripe o PayPal.
Quale abbonamento mi permette di accedere ai resoconti?
MarketScreener, in quanto media specializzato in notizie di Borsa, dà accesso a diversi tipi di contenuti (articoli, analisi, video, formazione, resoconto, ecc.). Con un semplice abbonamento Access potrai accedere a tutti i resoconti disponibili sul nostro sito web.
I resoconti, uno strumento essenziale per l'investitore informato, ti permetteranno di completare un'analisi approfondita di una società al di là del suo conto economico.
Se il mio abbonamento termina, perderò i miei dati/elenchi/portafogli?
In caso di abbonamento scaduto perderai l'accesso agli strumenti e ai servizi legati alla tua tipologia di abbonamento. Tuttavia, gli elenchi, i portafogli, ecc. non verranno cancellati e potrai accedervi nuovamente in qualsiasi momento con un abbonamento attivo.
Come posso cancellare il mio account?
Il controllo e la gestione dei tuoi dati personali sono elementi centrali per MarketScreener, pertanto potrai richiedere la cancellazione del tuo account in qualsiasi momento e in maniera molto semplice dirigendoti al nostro modulo di contatto > dati personali > cancellare i miei dati personali
Nel più breve tempo possibile, il nostro servizio clienti si occuperà della cancellazione del tuo account e riceverai un'e-mail di conferma dell'avvenuta cancellazione.
Hai altre domande?
Speriamo che abbiate trovato le risposte che cercavate. Se avete ancora delle domande, vi preghiamo di contattare il nostro servizio clienti composto da persone reali, esperti di finanza o del loro settore, che avranno a cuore di rispondere in modo qualificato a tutte le vostre domande.
Parlano di noi
Opinioni degli utenti
M
Matteo D. Ex Trader
Per un investitore che si basa sui fondamentali, MarketScreener è uno strumento potente: uno stock screener che permette di scovare i migliori titoli, dati finanziari e schede di azioni molto complete. Il monitoraggio dei portafogli di MarketScreener mi dà idee su chi posso (o non posso) seguire e gli articoli sono molto ben documentati. Non potrei farne a meno!
l
leo rizzo
Sono stato incredibilmente fortunato a scoprire MarketScreener! Da novellino totale, ho imparato molto grazie a tutti i dati e a un team incredibile sempre disponibile. Per me è il miglior sito di borsa (grafici d'effetto, tutte le news, stockscreener potentissimo, tante analisi tecniche e schede).
O
Osterman
L'unico media finanziario che permette di raggiungere professionisti che si sforzano di essere disponibili. Ho potuto migliorare durante il mio percorso di apprendimento grazie a un nuovo approccio all'insegnamento dei mercati finanziari. L'uso di un media trasforma profondamente la visione tradizionale della formazione dei professionisti dei dati.
R
Raffa G. Specialista Small Cap
MarketScreener è diventato IL punto di riferimento per l'informazione e la formazione sul mercato azionario e sui mercati finanziari in generale. Un Bloomberg per tutti insomma!
S
Splash
Sono ovviamente soddisfatto di questo sito che uso dai primi anni 2000. Penso che allora come oggi sia il miglior sito di borsa, molto ben fatto (grafici con tutte le notizie, diverse analisi tecniche e schede). Ho apprezzato molto l'aiuto ricevuto con i nuovi grafici per esperti e il tempo speso per spiegarmi come impostarli, davvero grazie!
C
CG
Sito molto completo, quotazioni in tempo reale, notizie ecc. Perfetto per seguire i propri investimenti.
S
Star44
Sito indispensabile per fare delle buone scelte!
M
Mary Fiorucci
credo che MarketScreener abbia tutta l'informazione finanziaria di cui ho bisogno
M
MrMe
Buoni consigli, un buon monitoraggio e persone disponibili e competenti
M
MARINO Alberto
Sito serio e ben documentato. I grafici sono facilmente configurabili.
M
Maria Vittoria ALVAREZ
Dal mio acquisto su be semiconductor qui consigliato, sono molto soddisfatto, quest'azienda merita di essere consigliata a lungo termine… Grazie
b
bionaz
Eccellente sito di informazioni sul mercato azionario con molti strumenti di supporto alle decisioni. Screener personalizzabili e molto intuitivi. Schede di valutazione complete e analisi delle società per settori. Lo consiglio vivamente, per me questo sito è un must.
T
Trevisan
Apprezzo la ricchezza dei contenuti del sito, lo screener. Le altre funzionalità sono ottime. Per il resto le informazioni sono ben presentate e generalmente, quando si cerca un'informazione la si trova.
G
Giorgetti
MarketScreener è oggi uno dei siti più completi in termini di monitoraggio dei mercati azionari. Abbonda di informazioni sulle Borse e i report in pdf sui titoli sono molto completi, anche se io valorizzerei maggiormente le vostre analisi tecniche.
D
De Padova
sono davvero molto soddisfatto del sito di MarketScreener, così tante informazioni in una sola pagina web! Penso che sia unico e che faccia risparmiare molto tempo, cosa che apprezzo molto.
M
Montanari
Apprezzo la completezza delle informazioni fornite; le sessioni di presentazione video mi sono molto utili per comprendere meglio gli strumenti; le opinioni e le posizioni assunte da MS sui titoli mi sembrano trasparenti;
P
Pier Francesco FERRARO
Probabilmente il sito più completo per le informazioni sul mercato azionario. Una gamma estremamente ampia di società analizzate e screener innovativi straordinariamente efficaci. Complimenti.
S
Sofia
È l'unico sito che ho trovato così completo. Con un minimo di ricerca, si trova tutto quello che si sta cercando. Quest'anno sono solo un po' delusa dal fatto che i vostri portafogli di investitori non siano migliori... Ma nessuno ha la sfera di cristallo, nemmeno i migliori!
Lavorano con noi
Mensile
Annuale
-20%
Access
Informazioni e dati per investitori autonomi esigenti
Access
-17%
24
29€€/mese
24
29€€/mese
Informazioni e dati per investitori autonomi esigenti